Datei:Simpson's paradox continuous.svg

Originaldatei (SVG-Datei, Basisgröße: 390 × 260 Pixel, Dateigröße: 18 KB)
![]()
Diese Datei und die Informationen unter dem roten Trennstrich werden aus dem zentralen Medienarchiv Wikimedia Commons eingebunden.
![]()
Beschreibung
| Beschreibung |
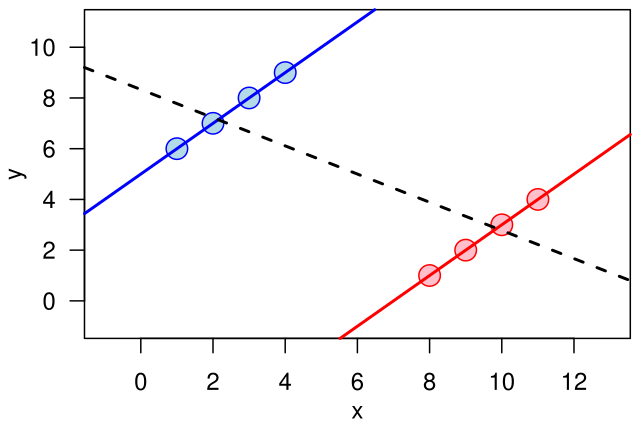
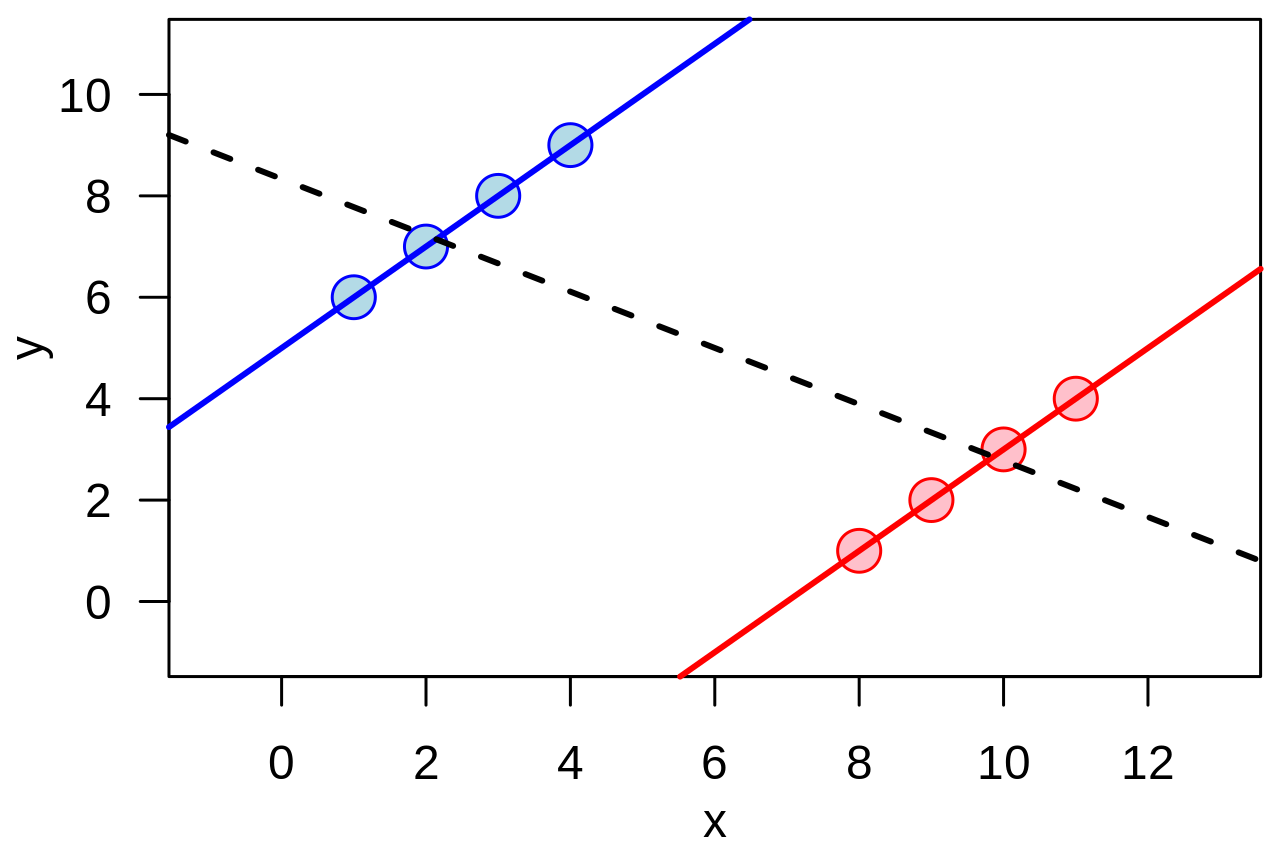
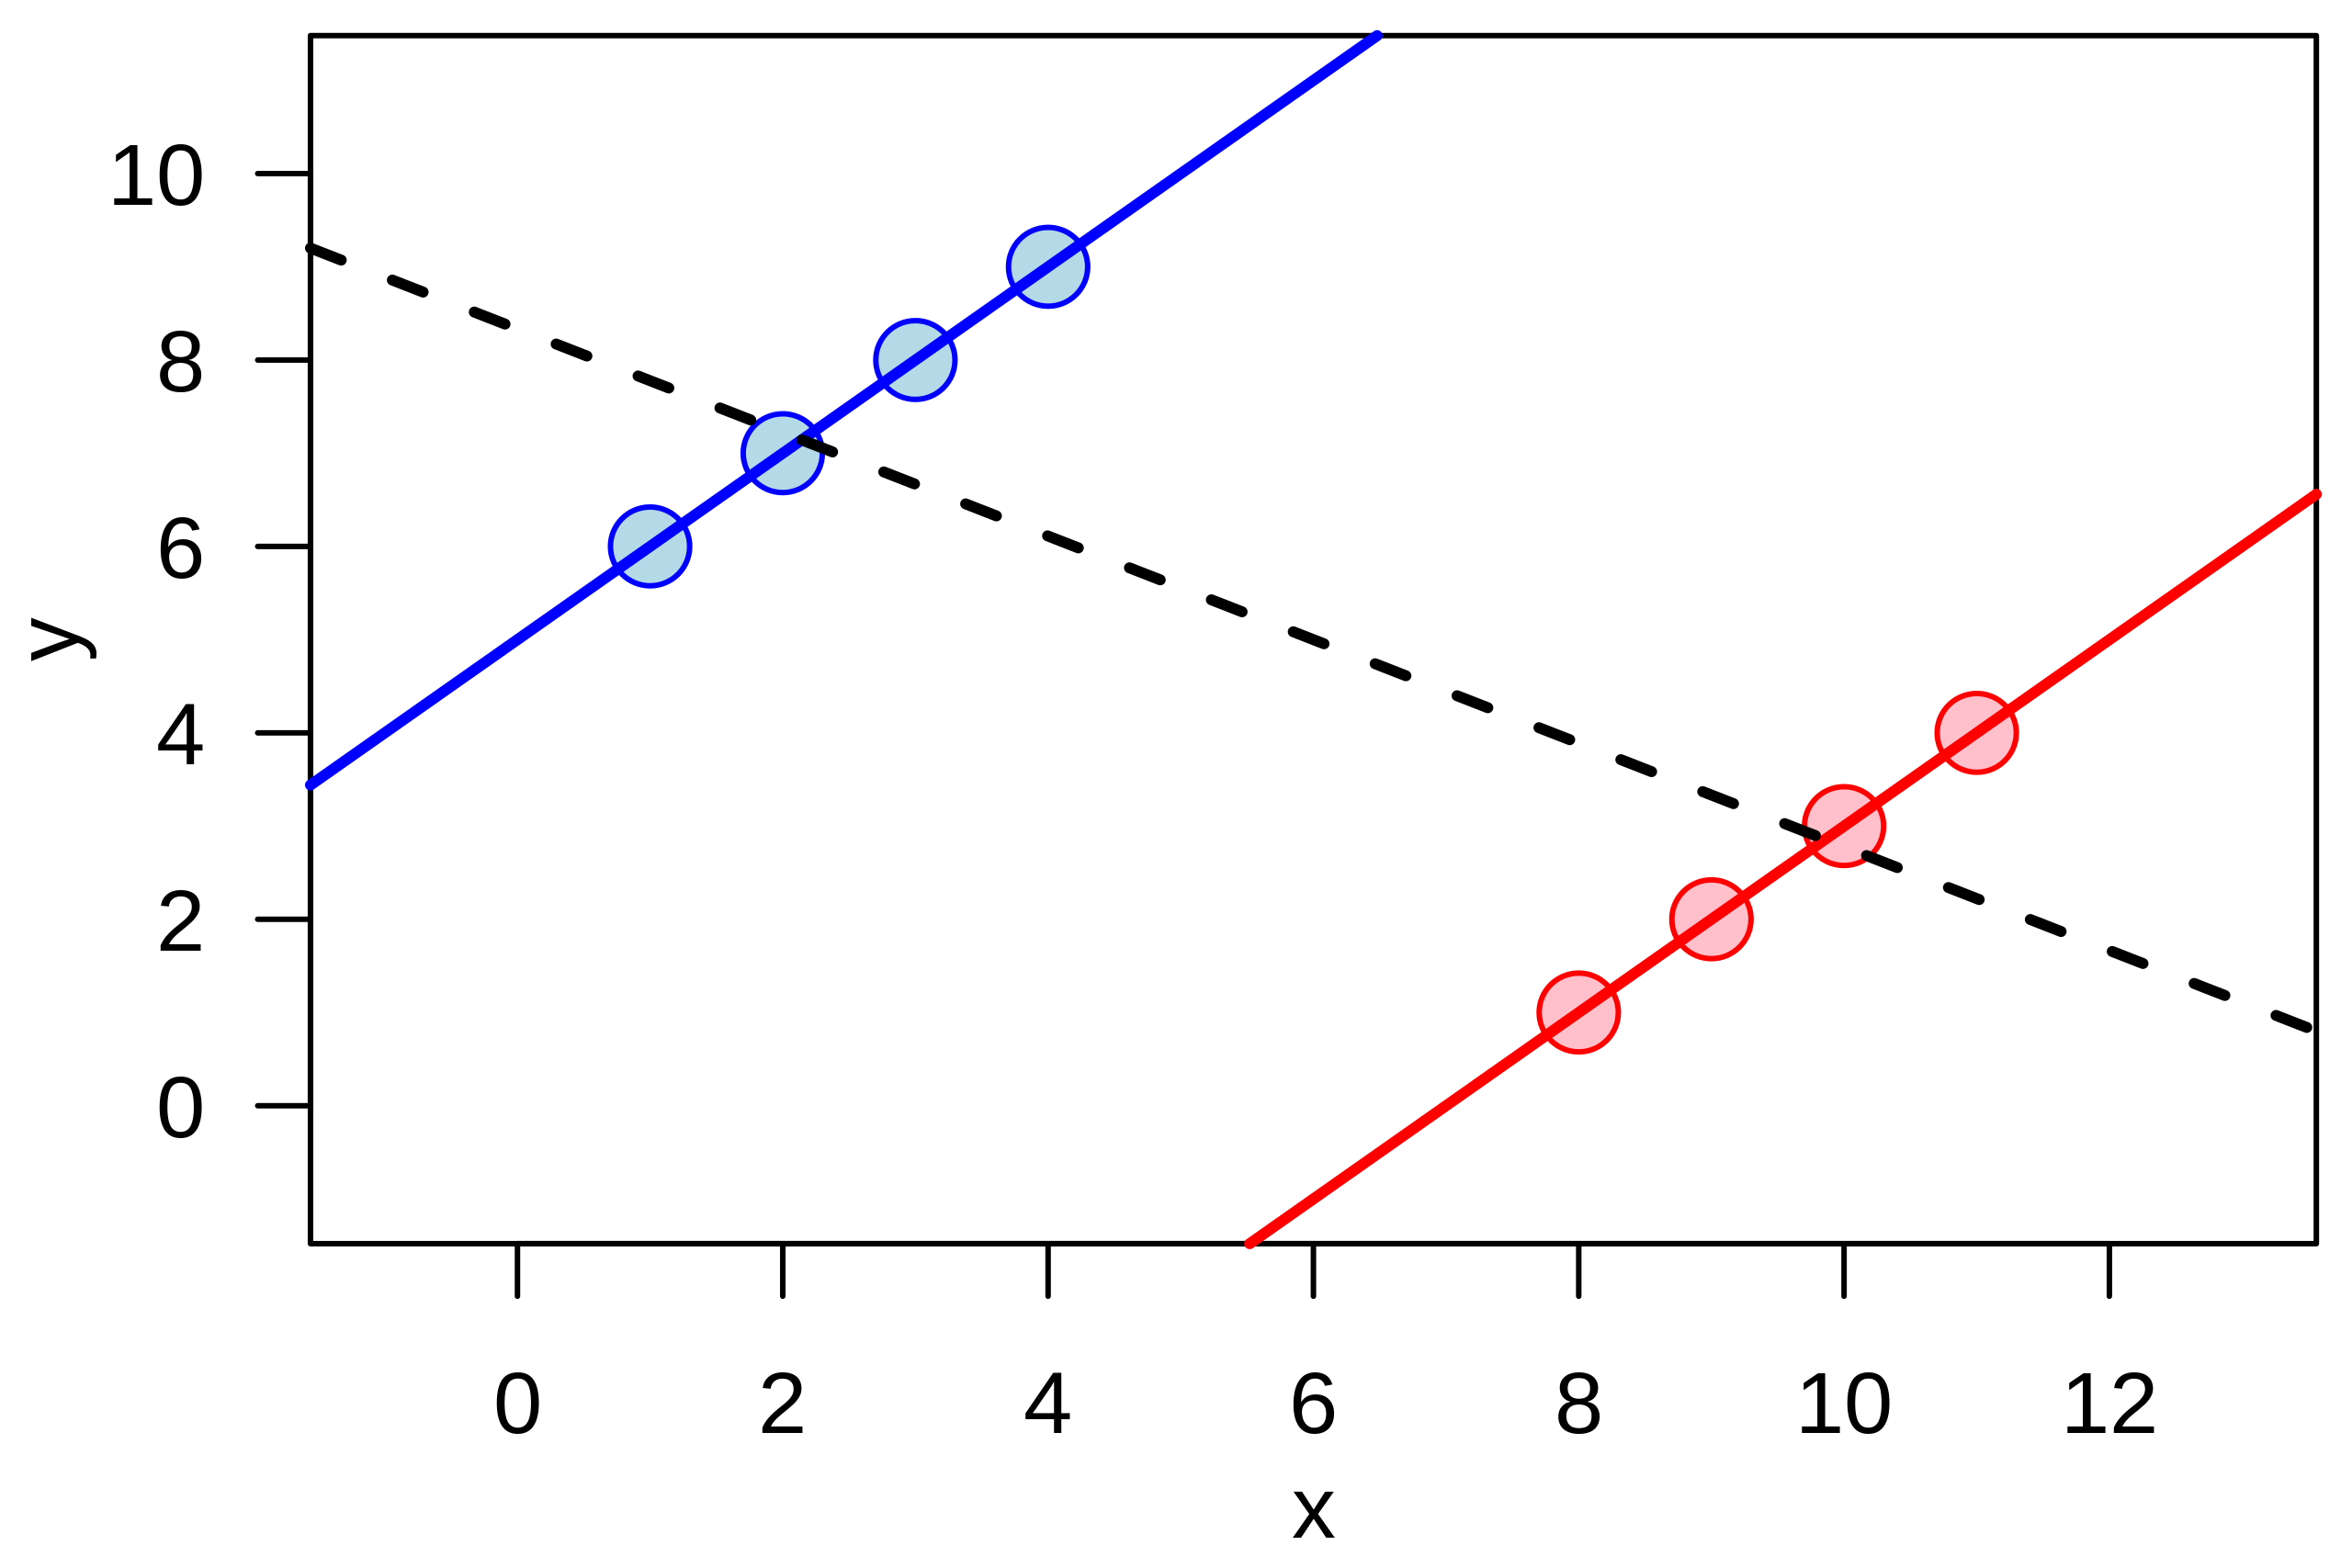
English: Illustration of the quantitative version of en:Simpson's paradox: a positive trend appears for two separate groups (blue and red), whereas a negative trend (black, dashed) appears when the groups are combined. |
| Datum | |
| Quelle | Eigenes Werk |
| Urheber | Schutz |
Example of the quantitative version of w:Simpson's paradox.
The graphic was created by User:Schutz for Wikipedia on 14 June 2007, using the R statistical project. The program that generated and exported the graphic is given below; the uploaded version was generated slightly differently to workaround a bug during the PS to SVG conversion with pstoedit command. The layout was slightly modified using Inkscape before upload.
  x1 <- c(1,2,3,4)
  y1 <- x1 + 5

  x2 <- x1 + 7
  y2 <- x2 - 7

  x <- c(x1,x2)
  y <- c(y1,y2)

  postscript("simpson.eps", paper="special", width=4.5, height=3)

  par(las=1)
  par(mar=c(3,3,0.5,0.5))
  par(mgp=c(2,1,0))

  plot(x,y, cex=2, pch=21,
       col=rep(c("blue", "red"), each=4), bg=rep(c("lightblue", "pink"), each=4),
       xlim=range(x)+c(-2,2), ylim=range(y)+c(-2,2))
  abline(lm(y1 ~ x1), col="blue", lwd=2)
  abline(lm(y2 ~ x2), col="red", lwd=2)
  abline(lm(y  ~ x), lwd=2, lty=2)

  dev.off()
Lizenz
| Dieses Werk wurde von seinem Urheber I, Schutz als gemeinfrei veröffentlicht. Dies gilt weltweit. In manchen Staaten könnte dies rechtlich nicht möglich sein. Sofern dies der Fall ist: I, Schutz gewährt jedem das bedingungslose Recht, dieses Werk für jedweden Zweck zu nutzen, es sei denn, Bedingungen sind gesetzlich erforderlich. |
Dateiversionen
Klicke auf einen Zeitpunkt, um diese Version zu laden.
| Version vom | Vorschaubild | Maße | Benutzer | Kommentar | |
|---|---|---|---|---|---|
| aktuell | 01:15, 14. Jun. 2007 | | 390 × 260 (18 KB) | Schutz | {{Information |Description=Illustration of the continuous version of Simpson's paradox |Source=self-made |Date=14 June 2007 |Author=Schutz }} Example of the continuous version of w:Simpson's paradox. The graphic was created by [[User |
Dateiverwendung
Die folgende Seite verwendet diese Datei:
Globale Dateiverwendung
Die nachfolgenden anderen Wikis verwenden diese Datei:
- Verwendung auf ar.wikipedia.org
- Verwendung auf ca.wikipedia.org
- Verwendung auf cs.wikipedia.org
- Verwendung auf cy.wikipedia.org
- Verwendung auf en.wikipedia.org
- Verwendung auf es.wikipedia.org
- Verwendung auf eu.wikipedia.org
- Verwendung auf fi.wikipedia.org
- Verwendung auf fr.wikipedia.org
- Verwendung auf he.wikipedia.org
- Verwendung auf ko.wikipedia.org
- Verwendung auf nl.wikipedia.org
- Verwendung auf no.wikipedia.org
- Verwendung auf pl.wikipedia.org
- Verwendung auf pt.wikipedia.org
- Verwendung auf ru.wikipedia.org
- Verwendung auf sk.wikipedia.org
- Verwendung auf ta.wikipedia.org
- Verwendung auf uk.wikipedia.org
- Verwendung auf vi.wikipedia.org
- Verwendung auf www.wikidata.org
- Verwendung auf zh.wikipedia.org