Datei:Butterworth response.png
Originaldatei (1.240 × 880 Pixel, Dateigröße: 86 KB, MIME-Typ: image/png)
![]()
Diese Datei und die Informationen unter dem roten Trennstrich werden aus dem zentralen Medienarchiv Wikimedia Commons eingebunden.
![]()
Beschreibung
| Beschreibung |
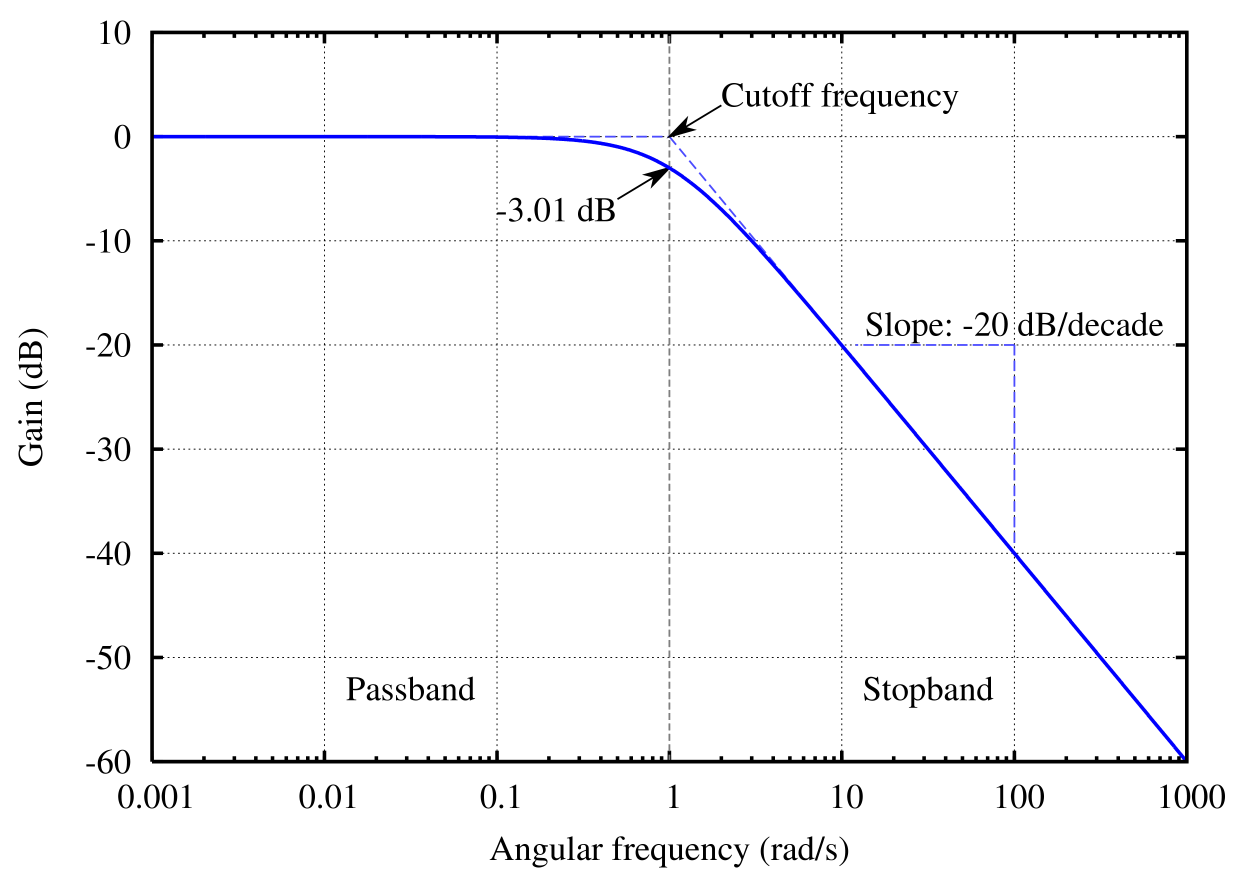
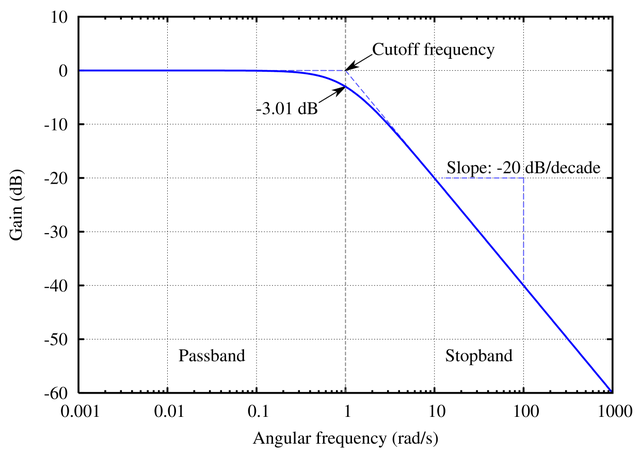
English: The frequency response of a Butterworth filter with logarithmic axes (Bode plot) and various labels. Cutoff frequency is normalized to 1 rad/s. Gain is normalized to 0 dB in the passband.
Many orders on one plot: File:Butterworth orders.png. Version with no text available at File:Butterworth plain.png, though you should probably just modify the source code and regenerate it in your own language. See Wikipedia graph-making tips. Dieser Plot wurde mit Gnuplot erstellt. Generated in gnuplot with the script below (save as butterworth.plt and then open in gnuplot). Then I opened the butterworth.ps file in a text editor to edit the line colors and linestyles, as per this description. This avoids needing to open in proprietary software, and really isn't that difficult (especially if you don't know the commands in the proprietary software either). ;-) Identify the lines easily by their color (the arrow is currently magenta and I want it to be black. Ah, there is the entry with 1 0 1, red + blue = magenta) or by using the gnuplot linestyle−1. (For instance, gnuplot's linestyle 3 corresponds to the ps file's /LT2.) Then you can edit the colors and dashes by hand. I changed the original: /LT0 { PL [] 1 0 0 DL } def
/LT1 { PL [4 dl 2 dl] 0 1 0 DL } def
/LT2 { PL [2 dl 3 dl] 0 0 1 DL } def
/LT3 { PL [1 dl 1.5 dl] 1 0 1 DL } def
into this: /LT0 { PL [] 0 0 1 DL } def
/LT1 { PL [4 dl 2 dl] 0.5 0.5 0.5 DL } def
/LT2 { PL [6 dl 3 dl] 0.3 0.3 1 DL } def
/LT3 { PL [] 0 0 0 DL } def
/LT4–/LT8 I left unchanged. (I don't know what they're used for anyway.) /LTw, /LTb, and /LTa are for the grid lines and such.To convert the PostScript file to PNG:
|
| Datum | 26. Juni 2005 (Hochladedatum) |
| Quelle | Eigenes Werk |
| Urheber | Omegatron |
| Andere Versionen |
|
| gnuplot source | click to expand
set samples 2001
set terminal postscript enhanced landscape color lw 2 "Times-Roman" 20
set output "butterworth.ps"

# Butterworth amplitude response and decibel calculation.  n is the order, which is just 1 in this image.
G(w,n) = 1 / (sqrt(1 + w**(2*n)))
dB(x) = 20 * log10(abs(x))

# Gridlines
set grid

# Set x axis to logarithmic scale
set logscale x 10

# Set range of x and y axes
set xrange [0.001:1000]
set yrange [-60:10]

# Create x-axis tic marks once per decade (every multiple of 10)
set xtics 10

# Use 10 x-axis minor divisions per major division
set mxtics 10

# Axis labels
set xlabel "Angular frequency (rad/s)"
set ylabel "Gain (dB)"

# No need for a key
set nokey #0.1,-25

# Frequency response's line plotting style
set style line 1 lt 1 lw 2

# Draw a separator between passband and stopband and label them
set style line 2 lt 2 lw 1
set style arrow 2 nohead ls 2
set arrow 3 from 1,-60 to 1,10 as 2

# Label coordinates are relative to the graph window, not to the function, centered at the 1/4 and 3/4 width points
set label 1 "Passband" at graph 0.25, graph 0.1 c
set label 2 "Stopband" at graph 0.75, graph 0.1 c

# Asymptote lines and slope lines are the same "arrow" style
set style line 3 lt 3 lw 1
set style arrow 3 nohead ls 3

# Draw asymptote lines
set arrow 1 from 1,0 to 1000,-60 as 3
set arrow 2 from .001,0 to 1,0 as 3

# -3 dB arrow style and arrow
set style line 4 lt 4 lw 1
set style arrow 4 head filled size screen 0.02,15,45 ls 4
set arrow 4 from 2,3 to 1,0 as 4

# "Cutoff frequency" label uses same coordinates as the function
set label 3 "Cutoff frequency" at 2,4 l

# "-3 dB" label
set arrow 5 from 0.5,-6 to 1,-3 as 4
set label 4 "-3.01 dB" at 0.5,-7 r

# Draw slope lines and label
set arrow 6 from 100,-20 to 12,-20 as 3
set arrow 7 from 100,-20 to 100,-39 as 3
set label 5 "Slope: -20 dB/decade" at 100,-18 c

# Plot the filter response
plot \
     dB(G(x,1)) ls 1  title "1st-order response"
|


|
File:Butterworth response.svg ist eine vektorisierte Version dieses Bildes. Diese sollte an Stelle des Rasterbildes verwendet werden, sofern sie nicht schlechter ist.
File:Butterworth response.png → File:Butterworth response.svg
Für weitere Informationen siehe Help:SVG. |
 |
Lizenz
- Dieses Werk darf von dir
- verbreitet werden – vervielfältigt, verbreitet und öffentlich zugänglich gemacht werden
- neu zusammengestellt werden – abgewandelt und bearbeitet werden
- Zu den folgenden Bedingungen:
- Namensnennung – Du musst angemessene Urheber- und Rechteangaben machen, einen Link zur Lizenz beifügen und angeben, ob Änderungen vorgenommen wurden. Diese Angaben dürfen in jeder angemessenen Art und Weise gemacht werden, allerdings nicht so, dass der Eindruck entsteht, der Lizenzgeber unterstütze gerade dich oder deine Nutzung besonders.
- Weitergabe unter gleichen Bedingungen – Wenn du das Material wiedermischst, transformierst oder darauf aufbaust, musst du deine Beiträge unter der gleichen oder einer kompatiblen Lizenz wie das Original verbreiten.

|
Es ist erlaubt, die Datei unter den Bedingungen der GNU-Lizenz für freie Dokumentation, Version 1.2 oder einer späteren Version, veröffentlicht von der Free Software Foundation, zu kopieren, zu verbreiten und/oder zu modifizieren; es gibt keine unveränderlichen Abschnitte, keinen vorderen und keinen hinteren Umschlagtext.
Der vollständige Text der Lizenz ist im Kapitel GNU-Lizenz für freie Dokumentation verfügbar. |
Dateiversionen
Klicke auf einen Zeitpunkt, um diese Version zu laden.
| Version vom | Vorschaubild | Maße | Benutzer | Kommentar | |
|---|---|---|---|---|---|
| aktuell | 19:45, 23. Jul. 2005 | | 1.240 × 880 (86 KB) | Omegatron | split the cutoff frequency markers |
| 18:31, 23. Jul. 2005 |  | 1.250 × 880 (92 KB) | Omegatron | Better butterworth filter response curve | |
| 21:54, 26. Jun. 2005 |  | 250 × 220 (2 KB) | Omegatron | A graph or diagram made by User:Omegatron. (Uploaded with Wikimedia Commons.) Source: Created by User:Omegatron {{GFDL}}{{cc-by-sa-2.0}} Category:Diagrams\ |
Dateiverwendung
Die folgende Seite verwendet diese Datei:
Globale Dateiverwendung
Die nachfolgenden anderen Wikis verwenden diese Datei:
- Verwendung auf be-tarask.wikipedia.org
- Verwendung auf eo.wikipedia.org
- Verwendung auf et.wikipedia.org
- Verwendung auf fr.wikipedia.org
- Verwendung auf hi.wikipedia.org
- Verwendung auf it.wikipedia.org
- Verwendung auf ja.wikipedia.org
- Verwendung auf pl.wikipedia.org
- Verwendung auf pt.wikipedia.org
- Verwendung auf zh.wikipedia.org