Datei:Diagram showing ten indicators of global warming.png
Originaldatei (3.191 × 1.691 Pixel, Dateigröße: 2,34 MB, MIME-Typ: image/png)
![]()
Diese Datei und die Informationen unter dem roten Trennstrich werden aus dem zentralen Medienarchiv Wikimedia Commons eingebunden.
![]()
Beschreibung
| Beschreibung |
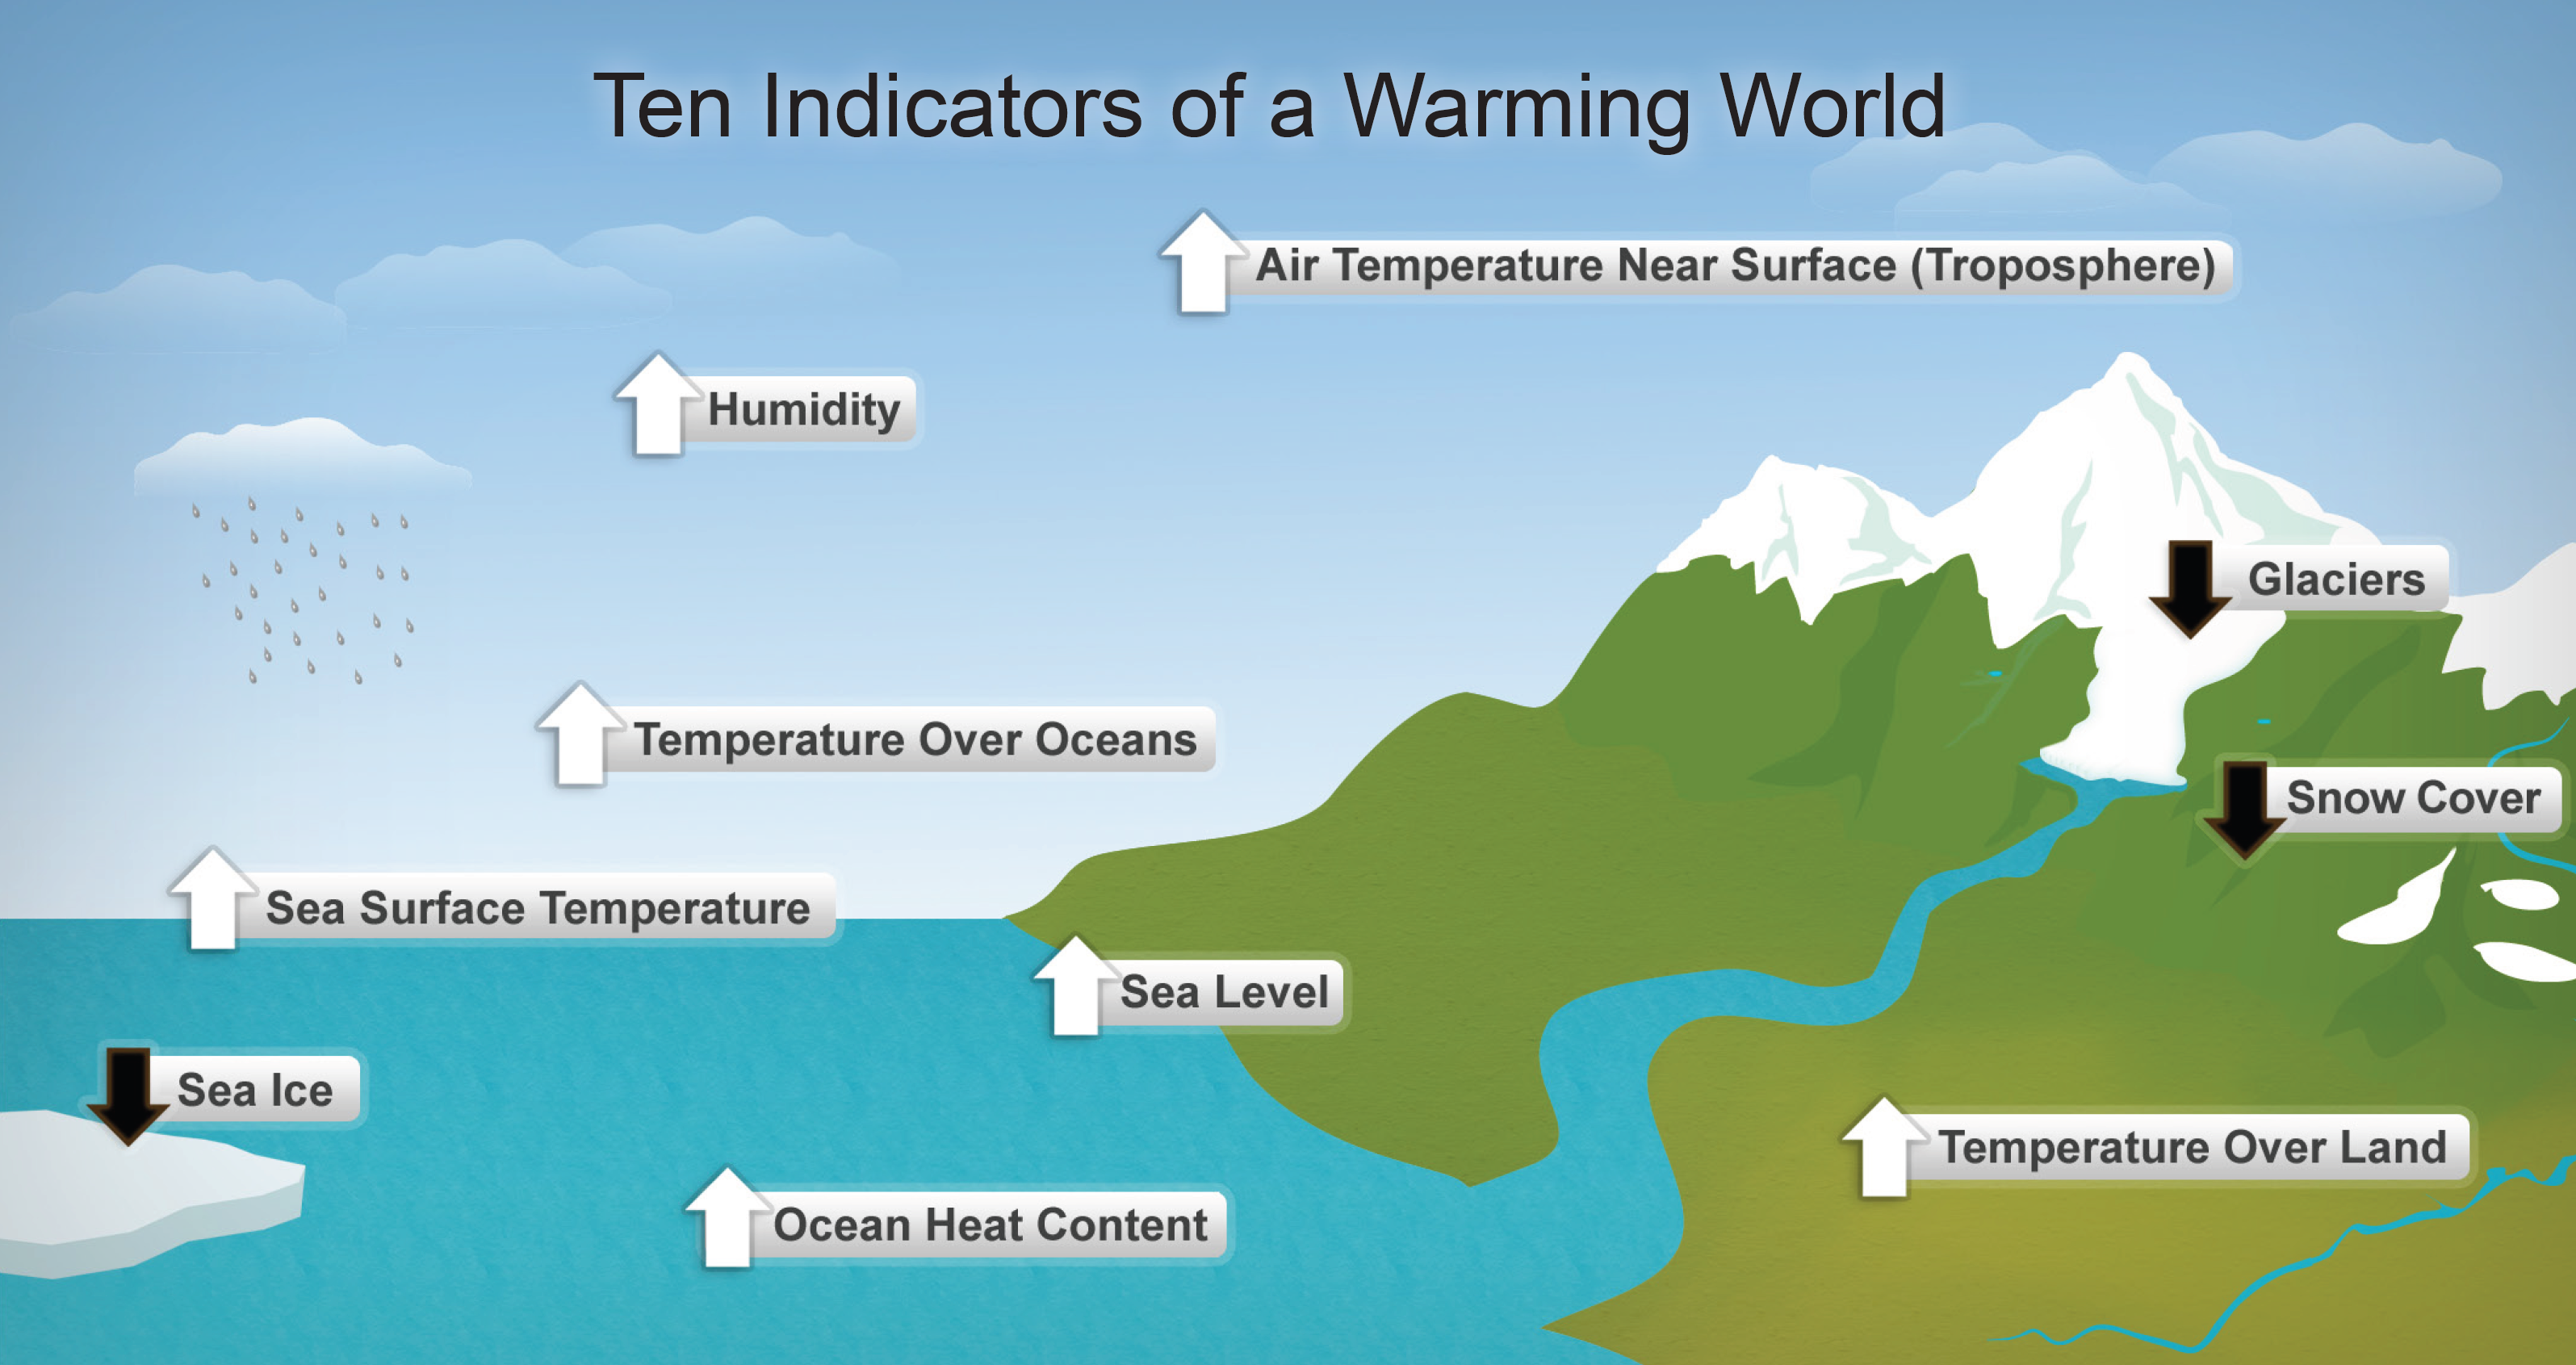
English: This diagram shows ten indicators of global warming: Seven of these indicators would be expected to increase in a warming world. These are:
Observations show that these 7 indicators are, in fact, increasing. The following three indicators would be expected to decrease in a warming world. These are:
Observations show that these 3 indicators are, in fact, decreasing. From page 2 of the cited public-domain source: "A comprehensive review of key climate indicators confirms the world is warming and the past decade was the warmest on record. More than 300 scientists from 48 countries analyzed data on 37 climate indicators, including sea ice, glaciers and air temperatures. A more detailed review of 10 of these indicators, selected because they are clearly and directly related to surface temperatures, all tell the same story: global warming is undeniable. For example, the surface air temperature record is compiled from weather stations around the world, and analyses of those temperatures from four different institutions show an unmistakable upward trend across the globe. But even without those measurements, nine other major indicators of climate change agree: the earth is growing warmer and has been for more than three decades. A warmer climate means higher sea level, humidity and temperatures in the air and ocean. A warmer climate also means less snow cover, melting Arctic sea ice and shrinking glaciers." See also effects of global warming. |
| Datum | |
| Quelle |
State of the Climate in 2009: Supplemental and Summary Materials: Report at a Glance: Highlights[1], US National Oceanic and Atmospheric Administration: National Climatic Data Center, (Please provide a date or year), page 2.
|
| Urheber | US National Oceanic and Atmospheric Administration: National Climatic Data Center |
| Genehmigung (Weiternutzung dieser Datei) |
"As required by 17 U.S.C. 403, third parties producing copyrighted works consisting predominantly of the material produced by U.S. government agencies must provide notice with such work(s) identifying the U.S. Government material incorporated and stating that such material is not subject to copyright protection within the United States. The information on government web pages is in the public domain and not subject to copyright protection within the United States unless specifically annotated otherwise (copyright may be held elsewhere). Foreign copyrights may apply." http://www.ngdc.noaa.gov/ngdcinfo/privacy.html |
| Andere Versionen |
Czech version |
Lizenz
Diese Datei ist gemeinfrei (public domain), weil sie Material enthält, das von einem Angestellten der National Oceanic and Atmospheric Administration im Verlaufe seiner offiziellen Arbeit erstellt wurde.
|
Dateiversionen
Klicke auf einen Zeitpunkt, um diese Version zu laden.
| Version vom | Vorschaubild | Maße | Benutzer | Kommentar | |
|---|---|---|---|---|---|
| aktuell | 07:33, 29. Nov. 2012 | | 3.191 × 1.691 (2,34 MB) | Enescot | {{Information |Description ={{en|1=This diagram shows ten indicators of global warming: Seven of these indicators would be expected to increase in a warming world. These are: *Air temperature near surface ([[:en:troposphere|tr... |
Dateiverwendung
Keine Seiten verwenden diese Datei.
Globale Dateiverwendung
Die nachfolgenden anderen Wikis verwenden diese Datei:
- Verwendung auf ar.wikipedia.org
- Verwendung auf el.wikipedia.org
- Verwendung auf fr.wikipedia.org
- Verwendung auf mk.wikipedia.org
- Verwendung auf no.wikipedia.org
- Verwendung auf vi.wikipedia.org