Datei:MultivariateNormal.png
Zur Navigation springen
Zur Suche springen
Größe dieser Vorschau: 793 × 600 Pixel. Weitere Auflösungen: 317 × 240 Pixel | 635 × 480 Pixel | 842 × 637 Pixel
Originaldatei (842 × 637 Pixel, Dateigröße: 159 KB, MIME-Typ: image/png)
![]()
Diese Datei und die Informationen unter dem roten Trennstrich werden aus dem zentralen Medienarchiv Wikimedia Commons eingebunden.
![]()

|
File:Multivariate normal sample.svg ist eine vektorisierte Version dieses Bildes. Diese sollte an Stelle des Rasterbildes verwendet werden, sofern sie nicht schlechter ist.
File:MultivariateNormal.png → File:Multivariate normal sample.svg
Für weitere Informationen siehe Help:SVG. |
 |
Beschreibung
| Beschreibung |
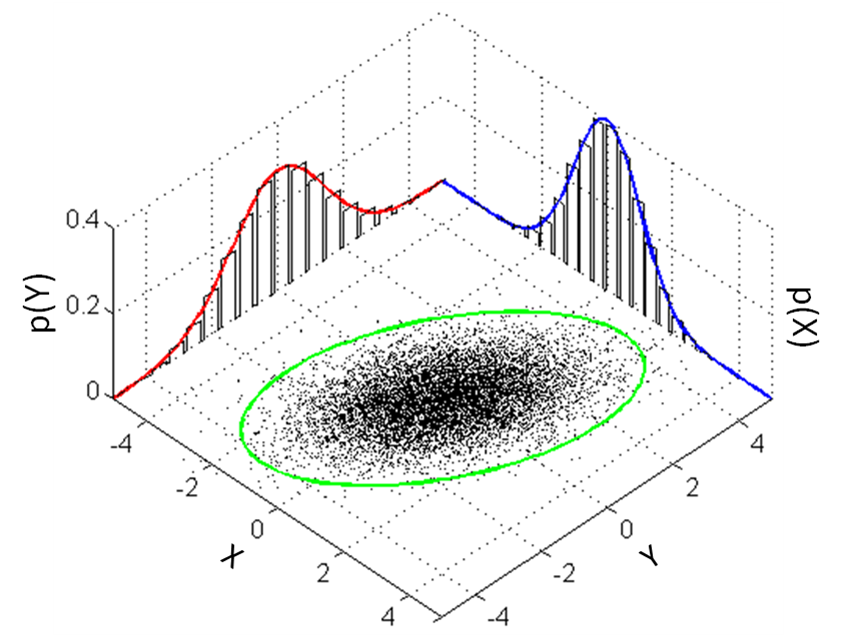
English: Illustration of a multivariate gaussian distribution and its marginals. Matlab code provided below. |
| Datum | |
| Quelle | Eigenes Werk |
| Urheber | Bscan |
%This script illustrates a multivariate Gaussian distribution and its
%marginal distributions

%This code is issued under the CC0 "license"

%Define limits of plotting
X = -5:0.1:5;
Y = -5:0.1:5;

%2-d Mean and covariance matrix
MeanVec = [0 0];
CovMatrix = [1 0.6; 0.6 2];

%Get the 1-d PDFs for the "walls"
Z_x = normpdf(X,MeanVec(1), sqrt(CovMatrix(1,1)));
Z_y = normpdf(Y,MeanVec(2), sqrt(CovMatrix(2,2)));

%Get the 2-d samples for the "floor"
Samples = mvnrnd(MeanVec, CovMatrix, 10000);

%Get the sigma ellipses by transform a circle by the cholesky decomp
L = chol(CovMatrix,'lower');
t = linspace(0,2*pi,100); %Our ellipse will have 100 points on it
C = [cos(t) ; sin(t)]; %A unit circle
E1 = 1*L*C; E2 = 2*L*C; E3 = 3*L*C; %Get the 1,2, and 3-sigma ellipses

figure; hold on;
%Plot the samples on the "floor"
plot3(Samples(:,1),Samples(:,2),zeros(size(Samples,1),1),'k.','MarkerSize',2)
%Plot the 1,2, and 3-sigma ellipses slightly above the floor
%plot3(E1(1,:), E1(2,:), 1e-3+zeros(1,size(E1,2)),'Color','g','LineWidth',2);
%plot3(E2(1,:), E2(2,:), 1e-3+zeros(1,size(E2,2)),'Color','g','LineWidth',2);
plot3(E3(1,:), E3(2,:), 1e-3+zeros(1,size(E3,2)),'Color','g','LineWidth',2);

%Plot the histograms on the walls from the data in the middle
[n_x, xout] = hist(Samples(:,1),20);%Creates 20 bars
n_x = n_x ./ ( sum(n_x) *(xout(2)-xout(1)));%Normalizes to be a pdf
[~,~,~,x_Pos,x_Height] = makebars(xout,n_x);%Creates the bar points
plot3(x_Pos, Y(end)*ones(size(x_Pos)),x_Height,'-k')

%Now plot the other histograms on the wall
[n_y, yout] = hist(Samples(:,2),20);
n_y = n_y ./ ( sum(n_y) *(yout(2)-yout(1)));
[~,~,~,y_Pos,y_Height] = makebars(yout,n_y);
plot3(X(1)*ones(size(y_Pos)),y_Pos, y_Height,'-k')

%Now plot the 1-d pdfs over the histograms
plot3(X, ones(size(X))*Y(end), Z_x,'-b','LineWidth',2);
plot3(ones(size(Y))*X(1), Y, Z_y,'-r','LineWidth',2);

%Make the figure look nice
grid on; view(45,55);
axis([X(1) X(end) Y(1) Y(end)])
Lizenz
Ich, der Urheber dieses Werkes, veröffentliche es unter der folgenden Lizenz:
| Diese Datei wird unter der Creative-Commons-Lizenz „CC0 1.0 Verzicht auf das Copyright“ zur Verfügung gestellt. | |
| Die Person, die das Werk mit diesem Dokument verbunden hat, übergibt dieses weltweit der Gemeinfreiheit, indem sie alle Urheberrechte und damit verbundenen weiteren Rechte – im Rahmen der jeweils geltenden gesetzlichen Bestimmungen – aufgibt. Das Werk kann – selbst für kommerzielle Zwecke – kopiert, modifiziert und weiterverteilt werden, ohne hierfür um Erlaubnis bitten zu müssen.
|
Dateiversionen
Klicke auf einen Zeitpunkt, um diese Version zu laden.
| Version vom | Vorschaubild | Maße | Benutzer | Kommentar | |
|---|---|---|---|---|---|
| aktuell | 21:30, 22. Mär. 2013 | | 842 × 637 (159 KB) | Bscan | User created page with UploadWizard |
Dateiverwendung
Die folgenden 2 Seiten verwenden diese Datei:
Globale Dateiverwendung
Die nachfolgenden anderen Wikis verwenden diese Datei:
- Verwendung auf ar.wikipedia.org
- Verwendung auf be.wikipedia.org
- Verwendung auf ca.wikipedia.org
- Verwendung auf cbk-zam.wikipedia.org
- Verwendung auf da.wikipedia.org
- Verwendung auf en.wikipedia.org
- Verwendung auf es.wikipedia.org
- Verwendung auf fa.wikipedia.org
- Verwendung auf fi.wikipedia.org
- Verwendung auf gl.wikipedia.org
- Verwendung auf ja.wikipedia.org
- Verwendung auf ko.wikipedia.org
- Verwendung auf pt.wikipedia.org
- Verwendung auf ru.wikipedia.org
- Verwendung auf sm.wikipedia.org
- Verwendung auf sr.wikipedia.org
- Verwendung auf uk.wikipedia.org
- Verwendung auf www.wikidata.org