Datei:Partition of unity illustration.svg
Zur Navigation springen
Zur Suche springen

Größe der PNG-Vorschau dieser SVG-Datei: 800 × 132 Pixel. Weitere aus SVG automatisch erzeugte PNG-Grafiken in verschiedenen Auflösungen: 320 × 53 Pixel | 640 × 106 Pixel | 1.024 × 169 Pixel | 1.280 × 211 Pixel | 2.560 × 422 Pixel | 5.400 × 891 Pixel
Originaldatei (SVG-Datei, Basisgröße: 5.400 × 891 Pixel, Dateigröße: 12 KB)
![]()
Diese Datei und die Informationen unter dem roten Trennstrich werden aus dem zentralen Medienarchiv Wikimedia Commons eingebunden.
![]()
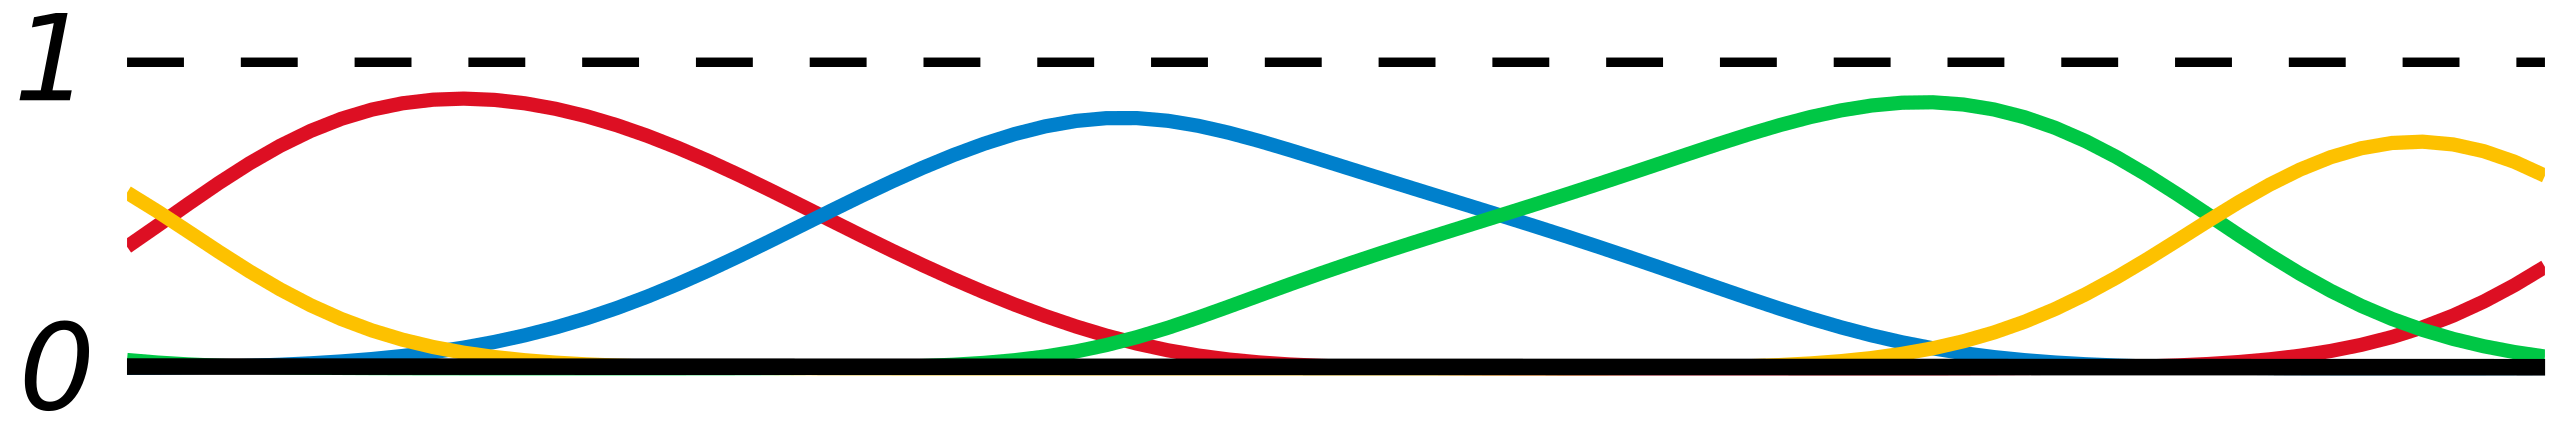
| Beschreibung | Illustration of en:Partition of unity |
| Datum | (UTC) |
| Quelle | self-made with MATLAB, tweaked in Inkscape |
| Urheber | Oleg Alexandrov |
| Ich, der Urheberrechtsinhaber dieses Werkes, veröffentliche es als gemeinfrei. Dies gilt weltweit. In manchen Staaten könnte dies rechtlich nicht möglich sein. Sofern dies der Fall ist: Ich gewähre jedem das bedingungslose Recht, dieses Werk für jedweden Zweck zu nutzen, es sei denn, Bedingungen sind gesetzlich erforderlich. |
Source code (MATLAB)
% illustration of partitition of unity.
% For simplicity, we cheat by using scaled sums of gaussians
% instead of bump functions.

function main()

   figure(1); clf; hold on; axis equal; axis off;
   lw = 2; % linewidth

   h=0.1; % grid size

%  endpoints of the interval
   a = -5; b = 10;

   Sample=[-2.1 -1.3 -0.4 1.3 1.8 3.1 4.5];

   red    = [0.867 0.06 0.14];
   blue   = [0, 129, 205]/256;
   green  = [0, 200,  70]/256;
   yellow = [254, 194,   0]/256;
   Colors = [red', blue', green', yellow']';

   L = [2 4 6 8];

   X=a:h:b;
   Y = zeros(length(L), length(X));
   Yt = 0*X;

   % gaussian with mean zero variance zsigma
   zsigma=0.55;
   f=inline('exp(-x.^2/2/zsigma)/zsigma/sqrt(2*pi)');

   pos = 1;
   for i=1:length(Sample)

      if i > L(pos)
         pos = pos+1;
      end

      Ycur = f(X-Sample(i), zsigma);
      Y(pos, :) = Y(pos, :) + Ycur;
      Yt = Yt+Ycur;

   end

   [Xtp, Ytp] = make_periodic (a, b, h, X, Yt);
   Yr = 0*Xtp;

   for pos=1:length(L)
      [Xp, Yp] = make_periodic (a, b, h, X, Y(pos, :));

      Yp = Yp./Ytp;
      Yr = Yr + Yp;
      plot(Xp, Yp, 'color',  Colors(pos, :), 'linewidth', lw);
   end

   plot(Xtp, 0*Yr, 'k', 'linewidth', lw);
   plot(Xtp, Yr, 'k', 'linewidth', lw/1.4, 'linestyle', '--');

   fs = 20;
   shiftx = -0.3;
   shifty = -0.0;

   text(Xtp(1)+shiftx, 0+shifty, '0', 'fontsize', fs);
   text(Xtp(1)+shiftx, 1+shifty, '1', 'fontsize', fs);

   saveas(gcf, 'Partition_of_unity_illustration.eps', 'psc2');
   %plot2svg('Partition_of_unity_illustration.svg');

function [Xp, Yp] = make_periodic (a, b, h, X, Y)

%  Take a function defined on the real line.
%  Wrap the real line around. Sum the overlapping parts.
%  Get a periodic function.

   T = 8;
   as = -3; bs = as+T;
   A = (as-a)/h;
   B = (bs-a)/h;

   N = length(Y);

   Y((B-A+1):B) = Y((B-A+1):B) + Y(1:A);
   Y((A+1):(A+N-B)) = Y((A+1):(A+N-B)) + Y((B+1):N);

   Yp = Y((A+1):B);
   Xp = X((A+1):B);
Dateiversionen
Klicke auf einen Zeitpunkt, um diese Version zu laden.
| Version vom | Vorschaubild | Maße | Benutzer | Kommentar | |
|---|---|---|---|---|---|
| aktuell | 06:03, 9. Aug. 2007 | 5.400 × 891 (12 KB) | Oleg Alexandrov | Fix bug | |
| 06:00, 9. Aug. 2007 | 512 × 84 (12 KB) | Oleg Alexandrov | Fix bug | ||
| 05:38, 9. Aug. 2007 | 579 × 89 (10 KB) | Oleg Alexandrov | {{Information |Description=Illustration of en:Partition of unity |Source=self-made with MATLAB, tweaked in Inkscape |Date=~~~~~ |Author= Oleg Alexandrov }} {{PD-self}} Category:Differential geometry |
Dateiverwendung
Die folgende Seite verwendet diese Datei:
Globale Dateiverwendung
Die nachfolgenden anderen Wikis verwenden diese Datei:
- Verwendung auf de.wikiversity.org
- Kurs:Mathematik (Osnabrück 2009-2011)/Teil III/Vorlesung 89
- Mannigfaltigkeit/Partition der Eins/Einführung/Textabschnitt
- Kurs:Analysis (Osnabrück 2013-2015)/Teil III/Vorlesung 88
- Kurs:Analysis (Osnabrück 2013-2015)/Teil III/Vorlesung 88/kontrolle
- Kurs:Analysis (Osnabrück 2014-2016)/Teil III/Vorlesung 88
- Kurs:Analysis (Osnabrück 2014-2016)/Teil III/Vorlesung 88/kontrolle
- Kurs:Differentialgeometrie (Osnabrück 2023)/Vorlesung 22
- Kurs:Differentialgeometrie (Osnabrück 2023)/Vorlesung 22/kontrolle
- Kurs:Mathematik (Osnabrück 2009-2011)/Teil III/Vorlesung 89/kontrolle
- Kurs:Maßtheorie auf topologischen Räumen/Interpolation von Gittern - NURBS
- Verwendung auf en.wikipedia.org
- Verwendung auf eo.wikipedia.org
- Verwendung auf es.wikipedia.org
- Verwendung auf fa.wikipedia.org
- Verwendung auf fr.wikipedia.org
- Verwendung auf it.wikipedia.org
- Verwendung auf ja.wikipedia.org
- Verwendung auf ko.wikipedia.org
- Verwendung auf uk.wikipedia.org
- Verwendung auf vi.wikipedia.org
- Verwendung auf www.wikidata.org